What matters most
- Use the controlled geometry, exact material model when available, gate, runner, process assumptions, cooling, and mesh strategy.
- Define which risks the study should compare instead of treating one output image as approval.
- Record the selected gate, wall, cooling, venting, material, or tool change and why it was chosen.
Connect every result to an engineering decision
Evaluate the technical choice together with part requirements, tooling consequences, production controls, and the evidence required for approval.
Inputs
Use the controlled geometry, exact material model when available, gate, runner, process assumptions, cooling, and mesh strategy.
Questions
Define which risks the study should compare instead of treating one output image as approval.
Decisions
Record the selected gate, wall, cooling, venting, material, or tool change and why it was chosen.
Correlation
Compare trial fill patterns, pressures, dimensions, temperatures, and distortion with the model.
Technical guide
The sections below retain the detailed design, tooling, process, and quality context needed to evaluate this topic beyond the summary.
Key Takeaways
- 1 Mold flow simulation covers four sequential phases — Fill, Pack, Cool, and Warp — each generating actionable outputs that directly drive gate location, cooling circuit layout, and wall thickness decisions before any steel is machined.
- 2 Running simulation before cutting steel can reduce design rework cycles by approximately 20%, compressing T1-to-production timelines by eliminating a full iteration loop that would otherwise require pulling, modifying, and retesting the mold.
- 3 Glass-filled resins (PA66-GF30, PP-GF20) require fiber orientation prediction from simulation — anisotropic shrinkage from fiber alignment causes warpage that material datasheets cannot predict and that only simulation reveals before T0.
- 4 A core-to-cavity temperature differential of less than 5°C — verified in the Cool phase — is the primary lever for locking warpage direction and achieving dimensional stability across a multi-cavity tool.
When an engineer asks a mold supplier “do you run Moldflow?” they are not asking about software licenses — they are asking whether the supplier can identify fill problems, weld line conflicts, and cooling imbalances before the mold ever enters the machining center. This guide explains what mold flow analysis produces, how each output maps to a tooling decision, and why skipping simulation shifts the cost of discovery from $500–$3,000 in simulation time to the significantly higher cost of emergency steel modifications after T1 trials.
The Four Simulation Phases and What Each Reveals
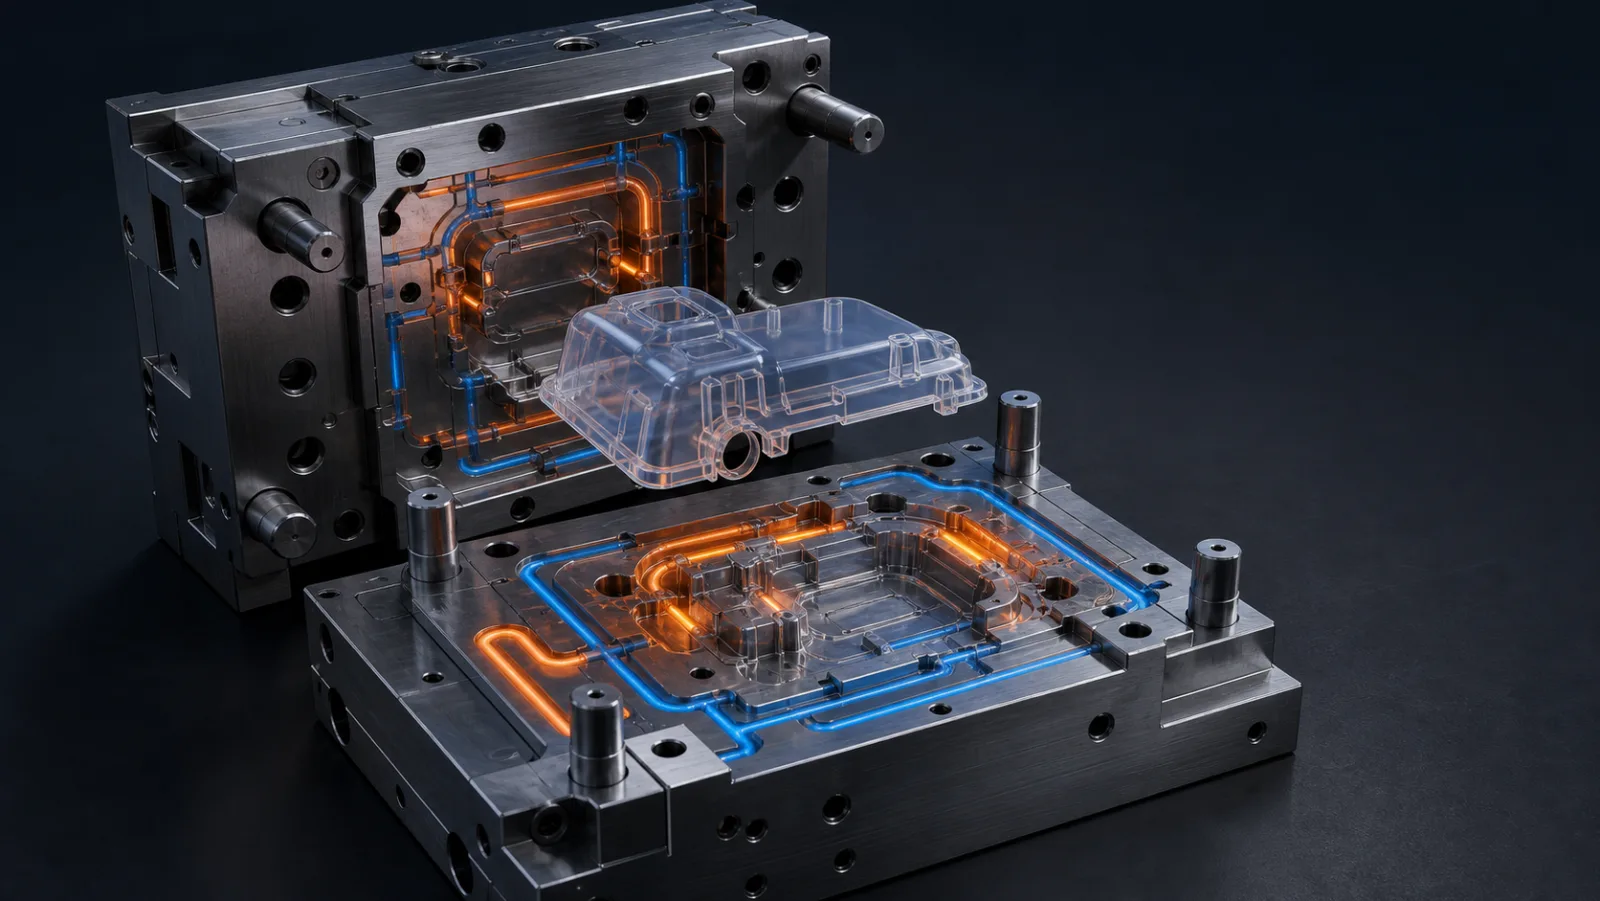
Mold flow analysis — performed using tools such as Autodesk Moldflow or the Taiwan-developed Moldex3D — breaks a 3D part geometry into a finite-element mesh and simulates the full injection cycle across four sequential phases. Each phase generates a distinct set of color-mapped outputs that translate directly into tooling decisions.
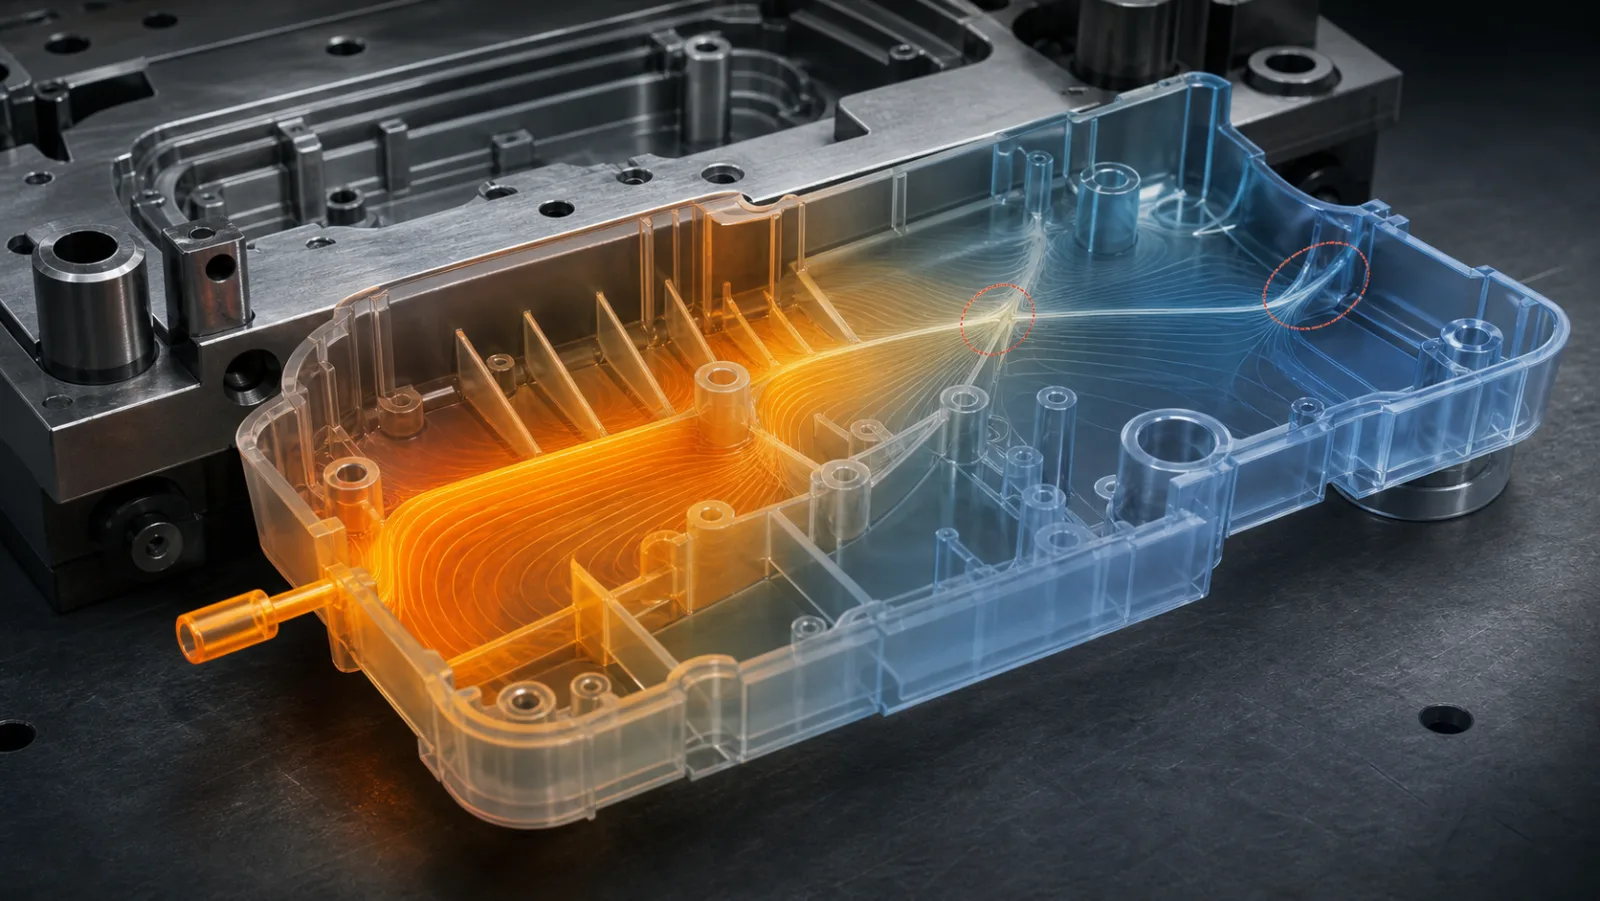
Fill Phase: The simulation tracks how the melt front advances through the cavity from gate to last-fill zone. Engineers identify flow hesitation zones (where the melt slows and risks premature freeze-off), shear-induced material degradation at the gate, and gate imbalance across cavities in a family mold. Weld line positions — where two melt fronts converge — are mapped relative to structural and cosmetic zone requirements on the part drawing. Air trap locations that require venting are flagged at this stage.
Pack Phase: After the cavity fills, packing pressure is applied to compensate for volumetric shrinkage as the plastic solidifies. The Pack phase quantifies shrinkage distribution across the part and flags regions prone to sink marks — typically above ribs or boss features where the local wall is thicker than the nominal wall section. The gate freeze time is confirmed here: the gate must remain open until packing is complete, or premature freeze-off causes internal voids and dimensional instability.
Cool Phase: According to Fictiv’s injection molding analysis guide, approximately 80% of the injection molding cycle time is consumed by cooling. The Cool phase maps thermal hot spots where heat from the melt is not adequately extracted, and verifies the core-to-cavity temperature differential (ΔT). Industry best practice targets a ΔT of less than 5°C between core and cavity surfaces; imbalances beyond this threshold bias the direction and magnitude of warpage. Effective cooling circuits target turbulent coolant flow at Reynolds number Re >4,000 to maximize heat transfer efficiency.
Warp Phase: The Warp phase combines residual stresses from fill, volumetric shrinkage from pack, and thermal gradients from cooling to predict the net deflection of the part relative to its nominal CAD geometry. CTQ (Critical to Quality) datums are displaced in the simulation output, allowing engineers to compare predicted dimensions against drawing tolerances before any steel is committed. Where predicted deflection exceeds the tolerance band, the mold design is corrected — or intentional pre-compensation (offset steel in the opposite direction) is applied.
Five Critical Outputs That Drive Tooling Decisions
A simulation report is only useful if its color plots are converted into specific tooling actions. Published mold simulation analysis identifies five outputs that most directly affect gate design, cooling circuit routing, and wall geometry decisions in the mold design package before machining begins.
| Simulation Output | Key Metric / Threshold | Tooling Decision Driven |
|---|---|---|
| Fill Pressure Drop (ΔP) | ≤80% of machine injection pressure capacity | Gate diameter, runner cross-section, and machine tonnage selection |
| Weld Line Map | Convergence angle <135° signals structural weld line risk | Gate repositioning, overflow/vent tab placement, cosmetic zone avoidance |
| Core/Cavity ΔT Balance | Target <5°C differential; coolant Re >4,000 for turbulent flow | Cooling channel diameter, pitch spacing, baffle or spiral insert placement |
| Gate Freeze Time | Gate must freeze after packing window closes | Gate land length, packing time duration, hold-pressure profile |
| Warp Displacement (CTQ) | Predicted datum shift vs. nominal CAD at tolerance limits | Pre-compensation steel offset, rib geometry changes, or gate relocation |
What Happens When Simulation Is Skipped: Defects vs. Pre-Steel Corrections
The cost difference between a simulation-guided design change and an emergency steel modification after T1 trials is typically an order of magnitude. Industry simulation data shows that running mold flow analysis before steel cut reduces redesign loops by approximately 20% — compressing a typical 3–4 rework iteration cycle down to 1 iteration between T1 and production approval. The table below maps common T1 defect types to the simulation phase that would have identified each one.
| Defect Found at T1 | Root Cause | Simulation Phase | Pre-Steel Correction |
|---|---|---|---|
| Short shot (incomplete fill) | Restricted flow path or insufficient injection pressure | Fill — pressure drop analysis | Increase gate diameter; widen runner cross-section |
| Weld line in structural zone | Melt fronts converging in a load-bearing region | Fill — weld line position map | Relocate gate to push weld line into non-critical zone |
| Sink marks above ribs | Inadequate packing; local wall thickness ratio >0.6 | Pack — shrinkage distribution | Reduce rib-to-nominal wall ratio; adjust gate freeze time |
| Warpage — diagonal twist | Asymmetric cooling; core/cavity ΔT >8°C | Cool & Warp — thermal map + deflection plot | Rebalance cooling circuits; add baffle inserts at thermal hot spots |
| Burn marks at end of fill | Trapped air with no vent path | Fill — air trap location map | Add vent slots at exact air trap coordinates flagged in simulation |
Glass-Filled Resins: Why Fiber Orientation Makes Simulation Non-Negotiable
For commodity resins such as unfilled PP or ABS, warpage from non-uniform cooling follows predictable patterns that an experienced mold designer can partially anticipate through rule-of-thumb correction. For glass-filled engineering resins — PA66-GF30, PP-GF20, PBT-GF15 — the mechanism is fundamentally different. As glass fibers align with the melt flow direction during the Fill phase, they create directional (anisotropic) shrinkage: the part shrinks significantly less in the flow direction than perpendicular to it. This differential can be three to five times larger than the isotropic shrinkage value on a material datasheet.
Simulation software such as Moldex3D (developed in Taiwan) and Autodesk Moldflow include dedicated fiber orientation solvers that compute how fibers align across each mesh element in the cavity. This fiber orientation tensor feeds directly into the Warp phase calculation, producing a deflection prediction that accounts for anisotropic behavior. Without fiber orientation data, a warpage prediction for a glass-filled component is fundamentally unreliable — the simulation will underpredict deflection in one axis and overpredict it in another, generating a false sense of dimensional confidence before T0.
For any structural component molded in a glass-filled or mineral-filled resin, a complete 4-phase simulation with fiber orientation enabled is not an optional enhancement — it is the minimum engineering diligence required before issuing a mold design package to the machining center.
Request Mold Flow Analysis as Part of Your DFM Review
LongTeam’s mold engineers run pre-steel simulation as a standard step in the Design for Manufacturability review process — identifying gate locations, cooling circuit layouts, and warpage risks before any tooling investment is committed. Our team uses simulation findings to inform specific gate, cooling, and warpage decisions; the analysis scope and expected impact are confirmed for each tooling program. Submit your 3D part data to start a DFM conversation.
Request a DFM and Mold Flow ReviewWhat to confirm before supplier review
Use the drawing, material specification, expected demand, application conditions, and acceptance requirements to turn a general process discussion into a program-specific review.
- Which decisions must the simulation support?
- Are the material and process inputs representative?
- Which alternatives were compared?
- How will trial evidence be used to update the model or tool?
Continue the engineering review
Use the related guides and capability pages to connect this topic to part geometry, tooling, molding, and qualification decisions.